A Pain in your Pocketbook
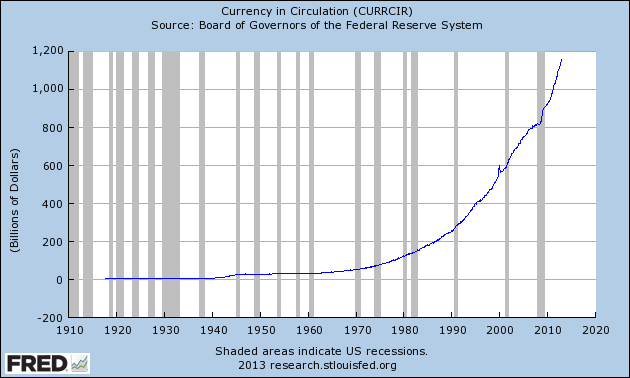
Currency in Circulation (CURRCIR)
2012-12: 1,159.053 Billions of Dollars Last 5 Observations
Monthly, Not Seasonally Adjusted, Updated: 2013-01-04 12:01 PM CST

PRINTABLE AREA ENDS HERE
We exceeded the US debt-ceiling of $16.39 trillion on Jan 1, 2013. The arguing hasn’t even begun yet, but the Treasury has already said it will begin tapping civil servant retirement funds because Congress has not yet raised the ceiling and we’re BROKE.
They WILL Raise the Ceiling
As Citigroup has predicted, “First Complacency, Then Horror” is the current and common path through these fiscal messes. Asset markets are likely to ignore the debt ceiling until the last minute, or even later, and then rather than being proactive people, we will be stuck in reactive panic.
There is no choice but to raise the debt ceiling. And debt is a self-imploding monster with a set path. The only question is not if but when the DEBT-BOMB explodes.
Raising the debt ceiling (or not raising the debt ceiling) has no effect on spending. Raising the ceiling simply allows the Treasury to pay for spending that congress has already approved. The bottom line is, debt cannot be reduced, period. We don’t pay the compounding interest on our debt; we borrow more money and add it back into the deficit.
The Treasury has debt running up to $28 trillion by 2018. That’s a $1.5 trillion deficit per year (plus compounded interest) for 6 years. Gold and gas prices follow debt. If the cost of gasoline to move your car (or get food to your area) is going to double by 2018 as debt doubles, so will gold. That means gold is protecting your purchase power against the coming debt bomb and the inflation that will follow.
Here’s the correlation between Debt, Gold and Gas since 2005. All debt-data is January 1st and gold-price data is based on the monthly average for the month of January:
- 2005 US Debt = 7.6T, Gold = $430/oz. Gas = $1.82/gallon
- 2006 US Debt = 8.1T, Gold = $520/oz. Gas = $2.28/gallon
- 2007 US Debt = 8.7T, Gold = $635/oz. Gas = $2.40/gallon
- 2008 US Debt = 10.7T, Gold = $875/oz. Gas = $2.90/gallon
- 2009 US Debt = 10.6T, Gold = $855/oz. Gas = $1.90/gallon
- 2010 US Debt = 12.3T, Gold = $1,100/oz. Gas = $2.80/gallon
- January 2011 US Debt = 14T, Gold = $1,360/oz. Gas = $3.15/gallon
- June 2011 US Debt = 14.3T, Gold = $1500/oz. Gas = $3.75/gallon
- May 2012 US Debt = 15.6T, Gold = $1650/oz. Gas = $3.90/gallon
- Oct 2012 US Debt = 16.2T, Gold = $1750/oz Gas = $4.25/gallon
-
- ***CORRECTION***
- *TODAY - FEBURARY 5th 2013 - GOLD IS ACTUALLY $1673/oz. and Gas = $3.509 / gallon National Average.*
- So it looks like these charts are off by 6 months to a year. Don't Worry - Be Happy ---PARTY TIME !
-
And here’s where we’re going:
- 2013 US Debt = 17T, Gold = $1,875/oz. Gas = $4.50/gallon
- 2014 US Debt = 18.8T, Gold = $2,200/oz. Gas = $5.00/gallon
- 2015 US Debt = 21T, Gold = $2,600/oz. Gas = $6.00/gallon
- 2016 US Debt = 22.7T, Gold = $3,100/oz. Gas = $6.75/gallon
- 2017 US Debt = 25.5T, Gold = $3,575/oz. Gas = $7.50/gallon
- 2018 US Debt = 27-28T, Gold = $3,800/oz. Gas = $8-9/gallon
-
And so on, with many outside shots of inflation breaking out, banking systems imploding, currencies failing, or any host of black-swan events that could speed this trajectory.

 ew
ew
 late.com
 ill
ill
 nure
nure
 espect


